Introducing Spotlight ✧˙.
The cutting edge of detection is here.
Learn More >>
Why Choose MIPAR?
Facing tedious and variable measurements from images, researchers use MIPAR to detect and measure features:
|
Check Out Some Applications
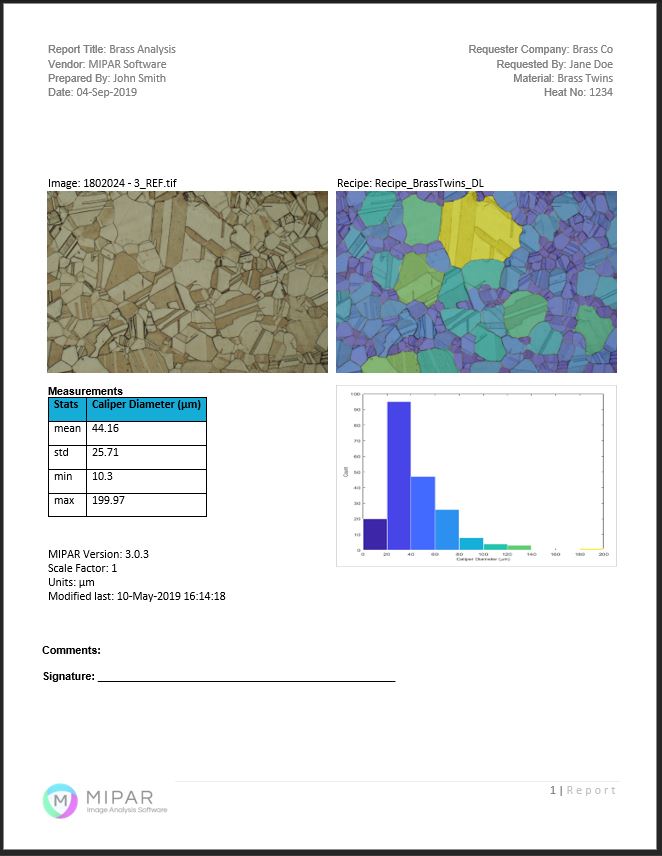
Copper alloy grain size measurement following ASTM E-112 standard.
Fully automated grain size solution, analyze micrographs off of the microscope or run sample data sets in batch. MIPAR generates a grain size distribution as well as data statistics. Fully integrated reports are generated for easy data sharing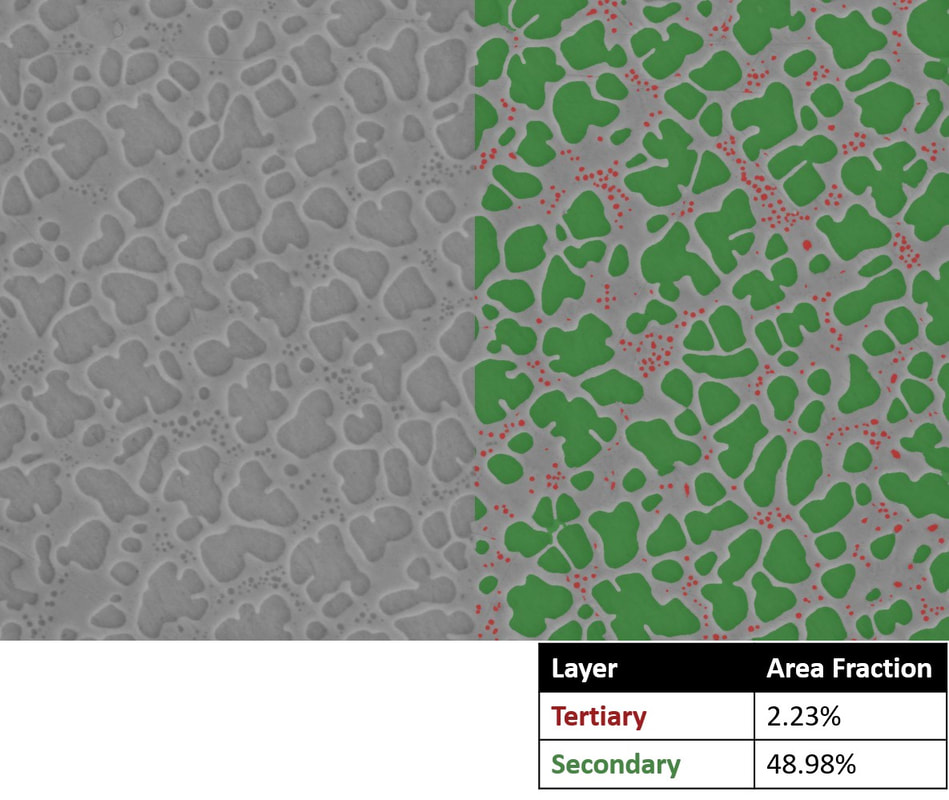
Nickel-base superalloy, secondary and tertiary gamma prime precipitates (citation)
Fully automated and chemically validated solution.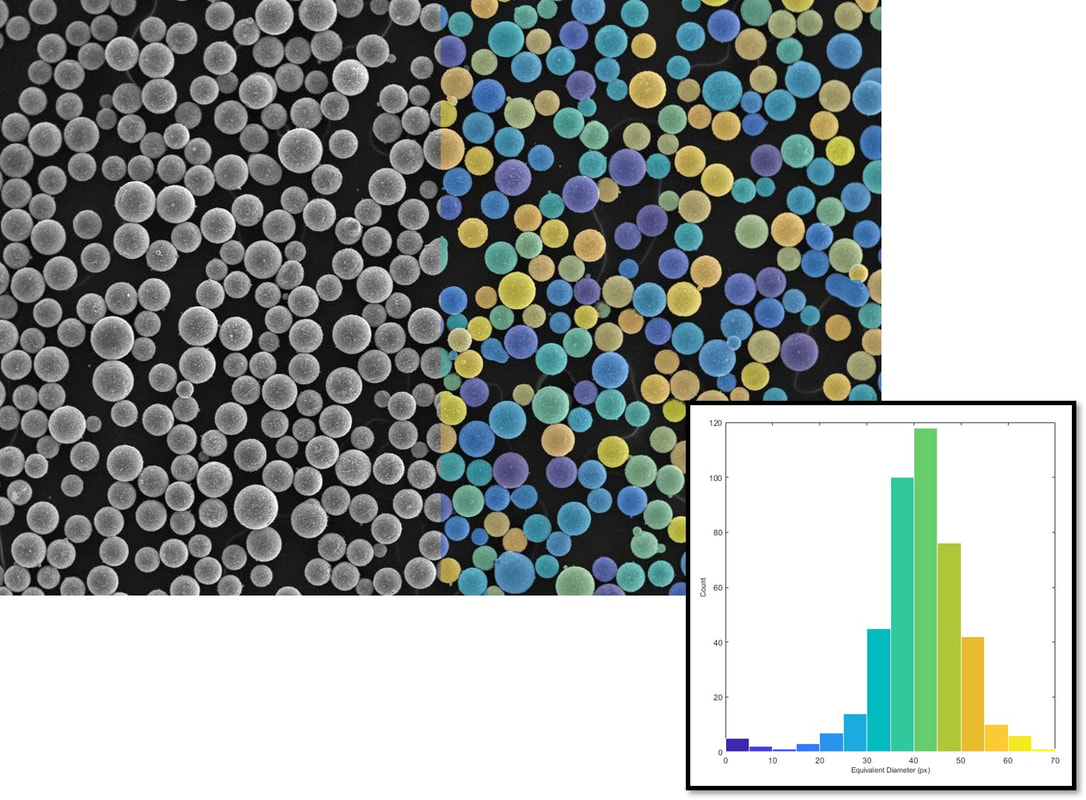
Metal powder particle size and shape characterization
Fully automated solution for quantifying particle size, roundness, and satellites. Analyze a single scan or batch a sample set.
Nanofiber porosity and thickness analysis
Quantify fiber density, void porosity and fiber thickness distribution.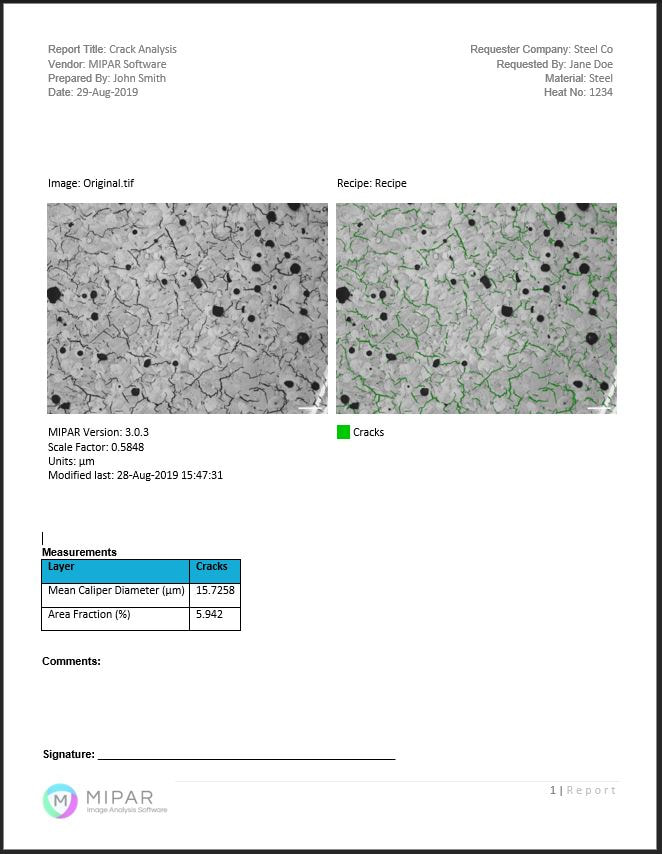
Crack analysis, identify part defects
Quantify additive manufacturing crack density, size distribution, localized density. Fully automated solution for quantifying a single field or an entire surface stitch.
 Original image by Nephron/Wikimedia Commons. CC BY-SA 3.0.
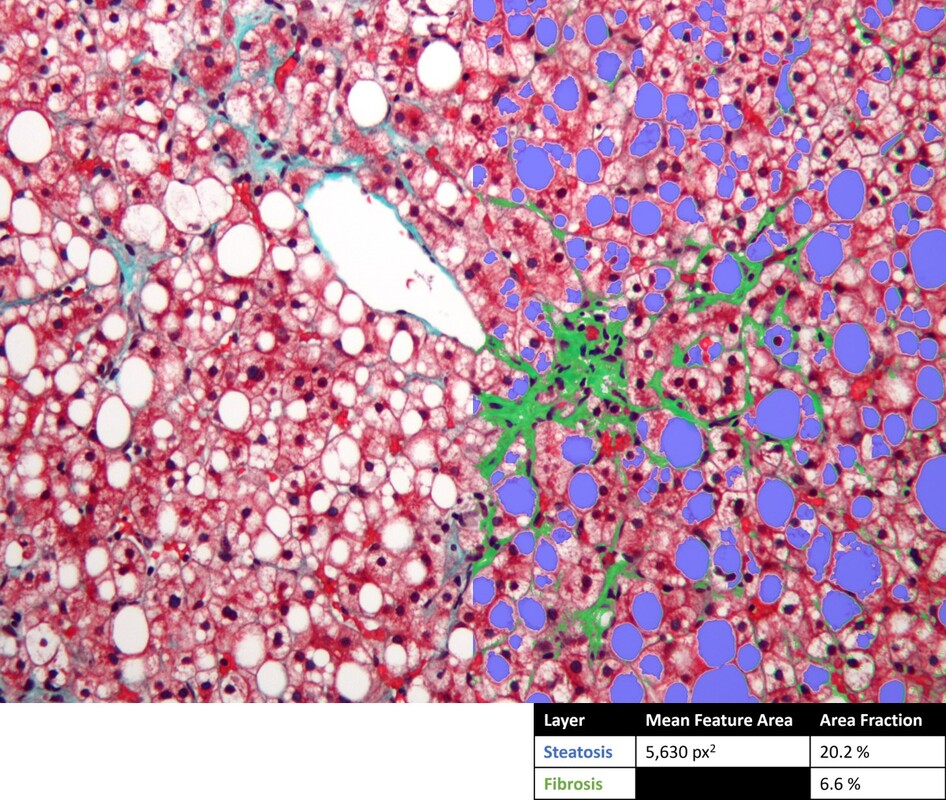
Masson's trichrome staining of non-alcoholic fatty liver disease
Fully automated identification and quantification of fibrosis and stenosis.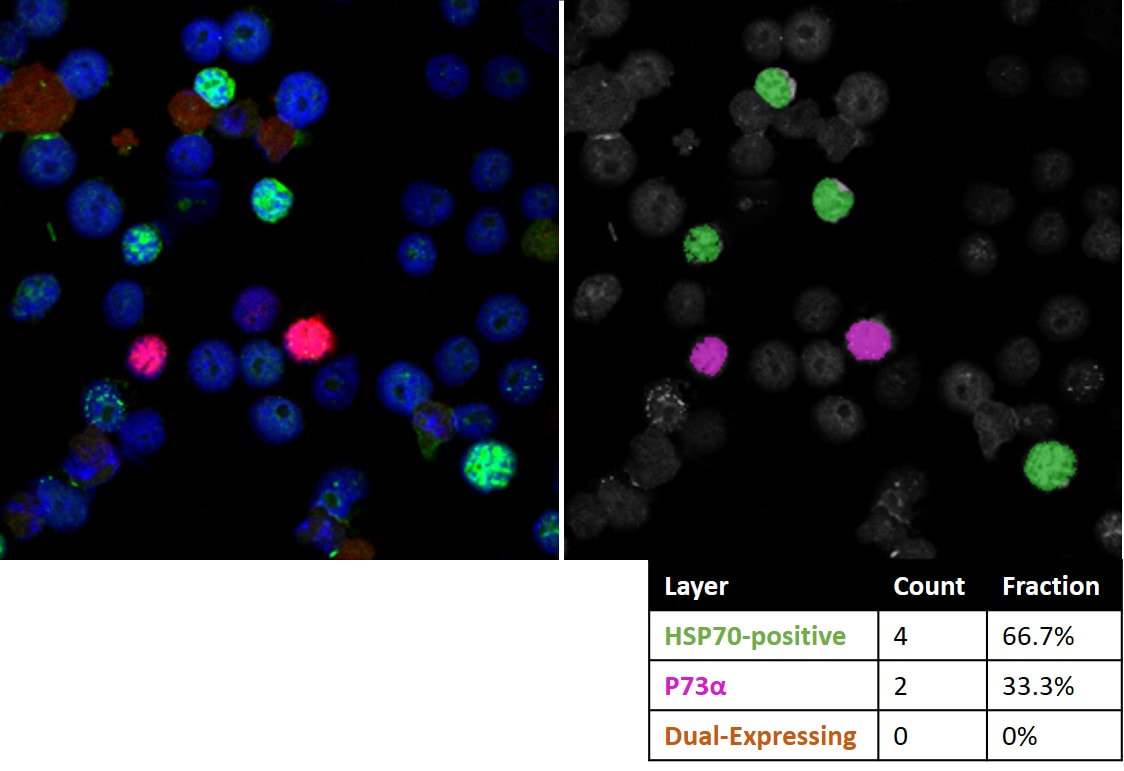 Original image by Flickr/mamarie. CC BY-SA 2.0.
Cells expressing fluorescently-labeled HSP70 (green) and/or P73α (red).
Fully automated count of nuclei, with the percentage expressing HSP70, P73α, or both.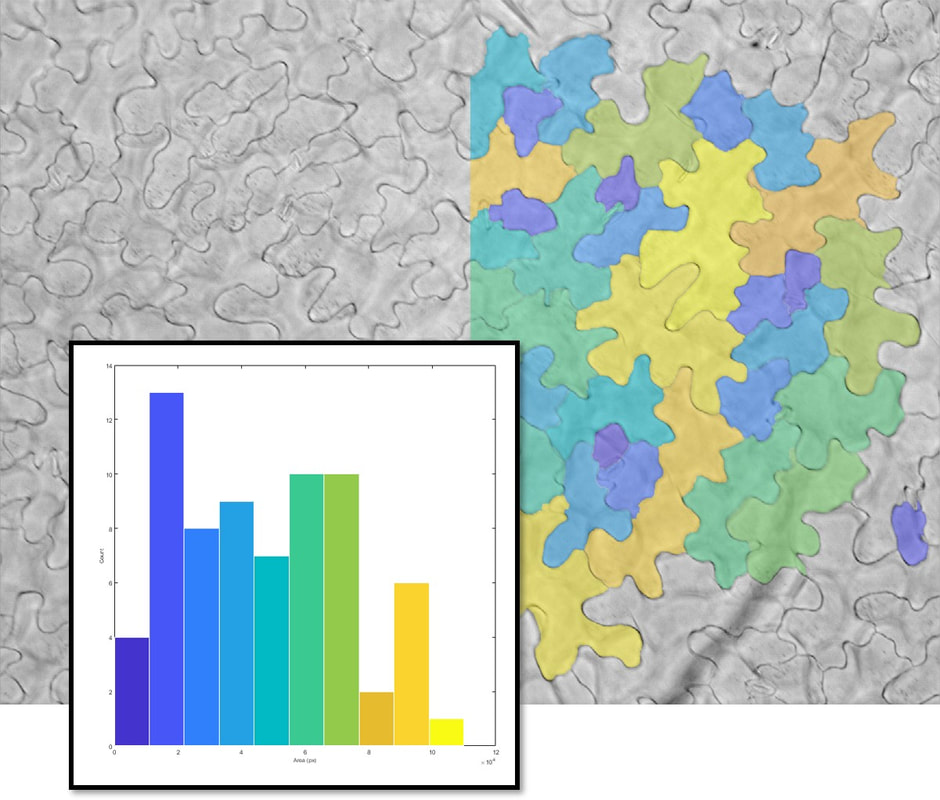
 Original image by Andrew Romanowski
DIC micrographs of leaf epidermis
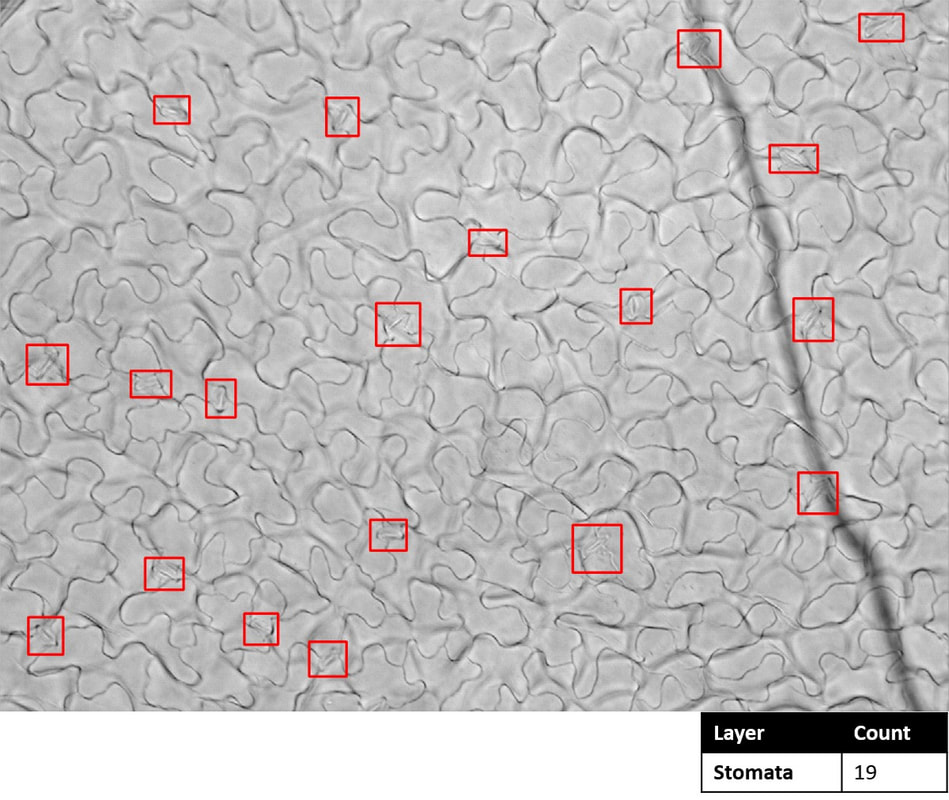
Semi-automated identification of epidermal cells, saving time and increasing accuracy in the face of challenging imagesFully-automated identification of stomata, powered by deep learning.
 Original image courtesy of Aadil El-Turabi
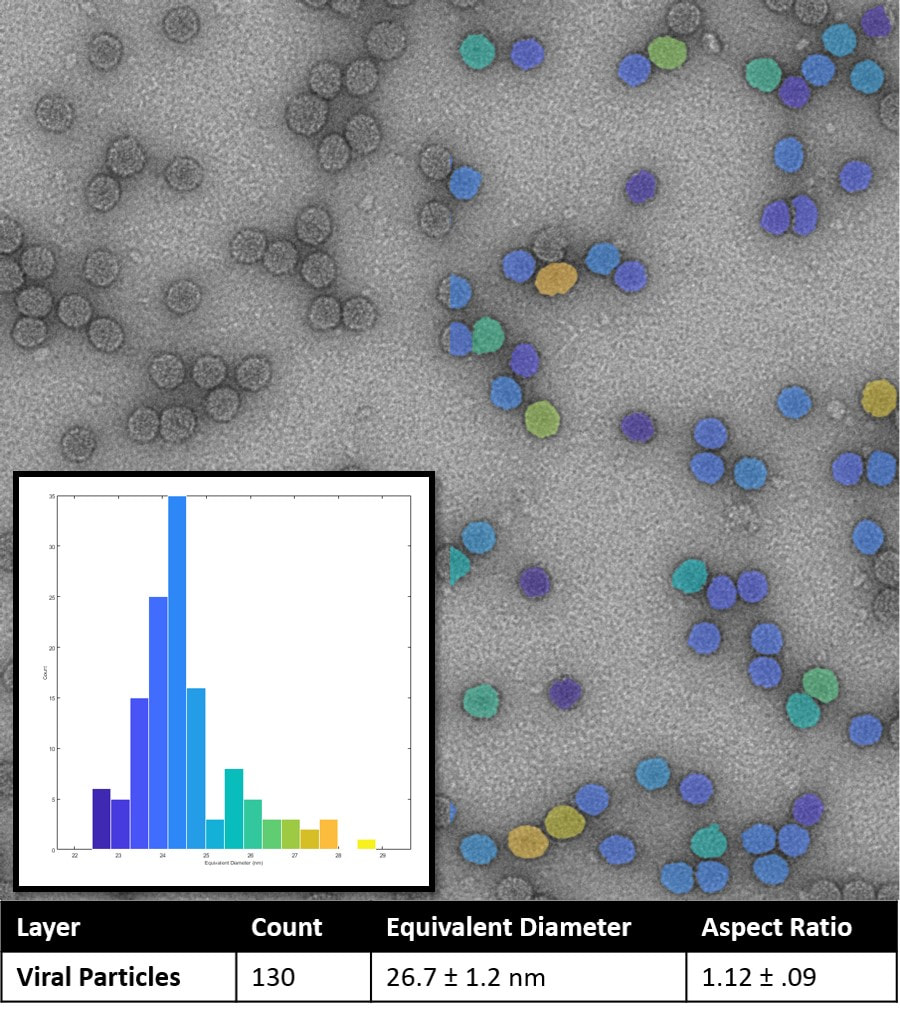
Electron microscopy of viral particles
Fully automated virus identification, with diameter and shape measurement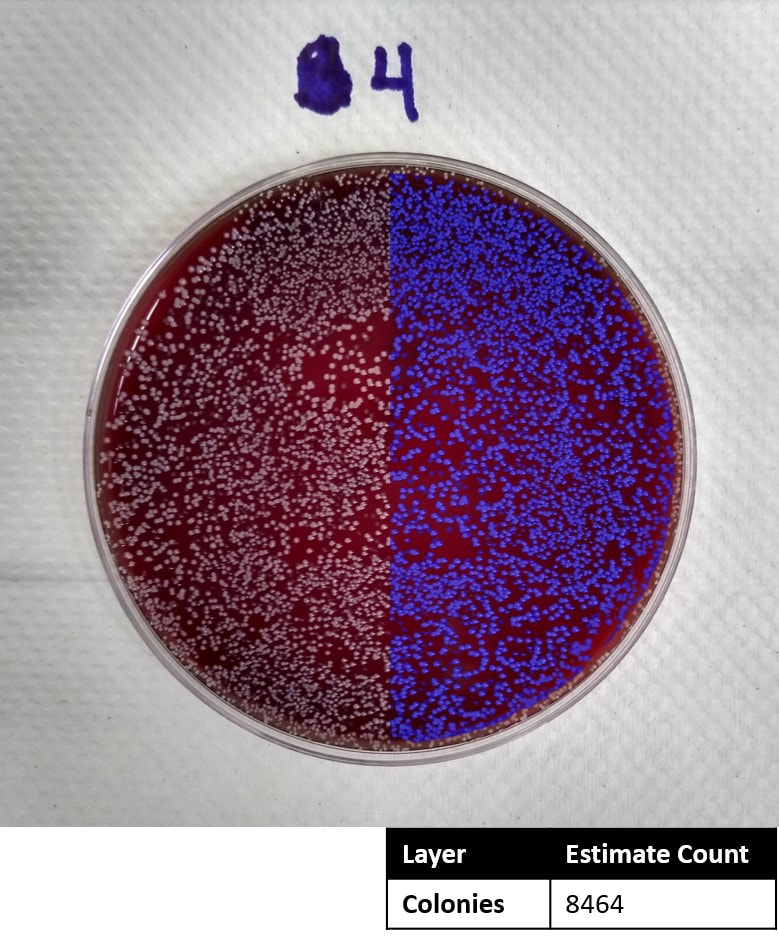 Original image courtesy of Faith Brennan
Bacterial colonies on an agar plate
Automatic plate detection
Estimated count of colonies which have grown together
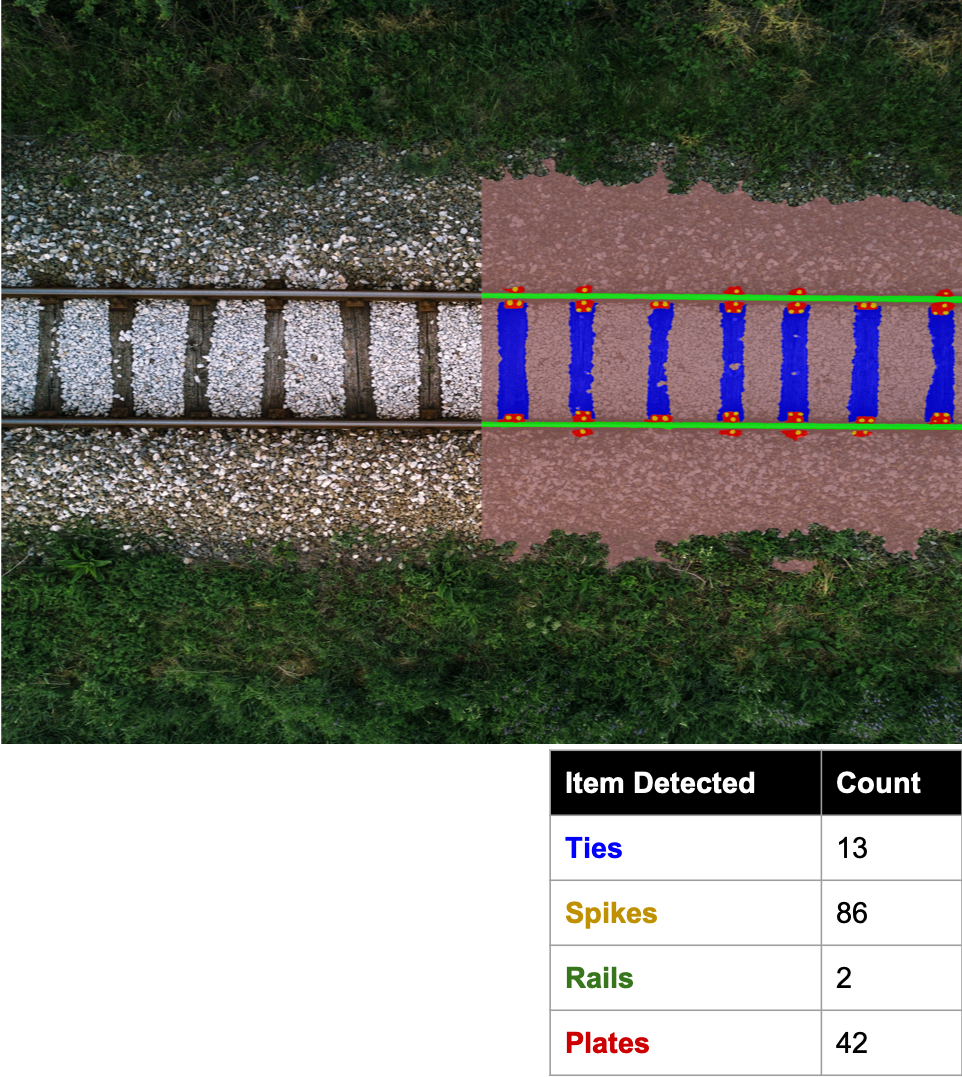
Automated railtrack inspection via drone imaging
Railtrack components quantified from drone imagery as part of a weekly railway inspection mandated by the federal railroad administration (FRA)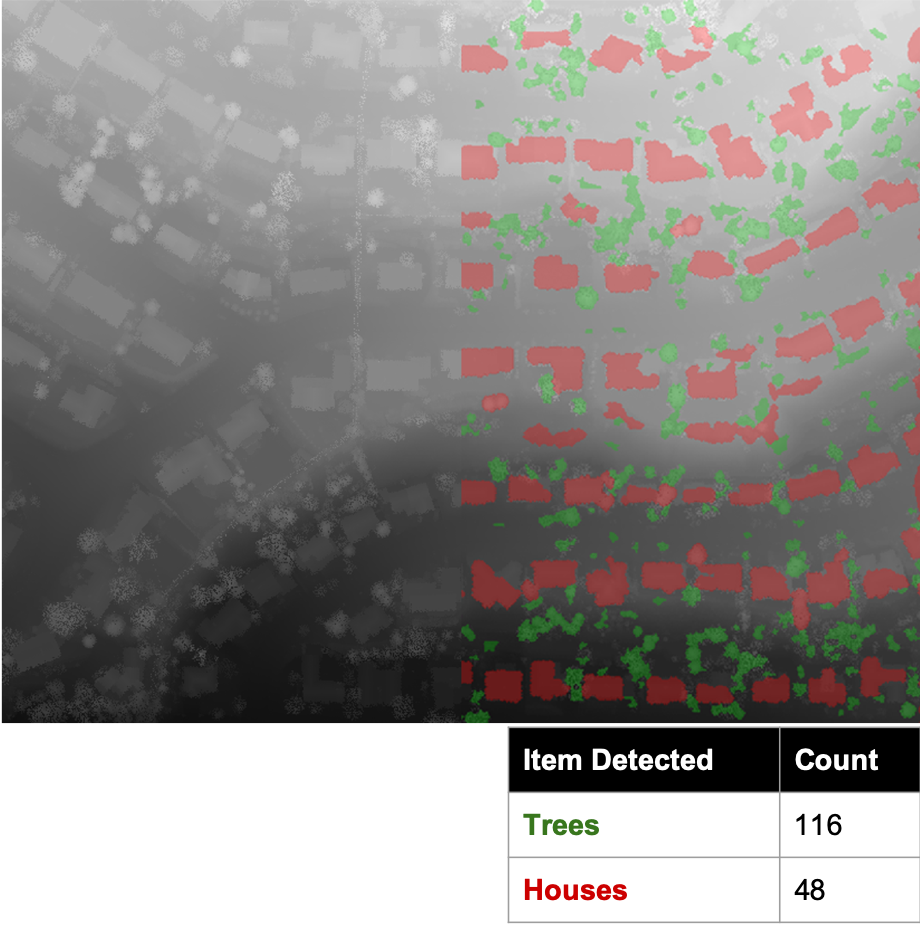
Remote sensing of houses and trees in residential community
Objects automatically detected and classified into houses and trees, with a count of each class reported.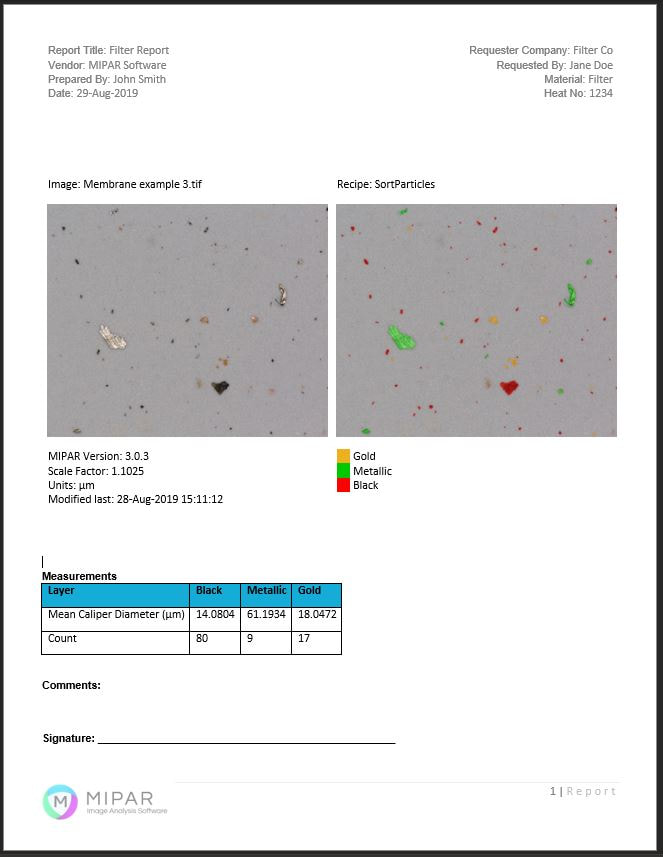
Filter paper contaminant classification and size measurement
Detected contaminants are classified into predefined types and the size and shape reported.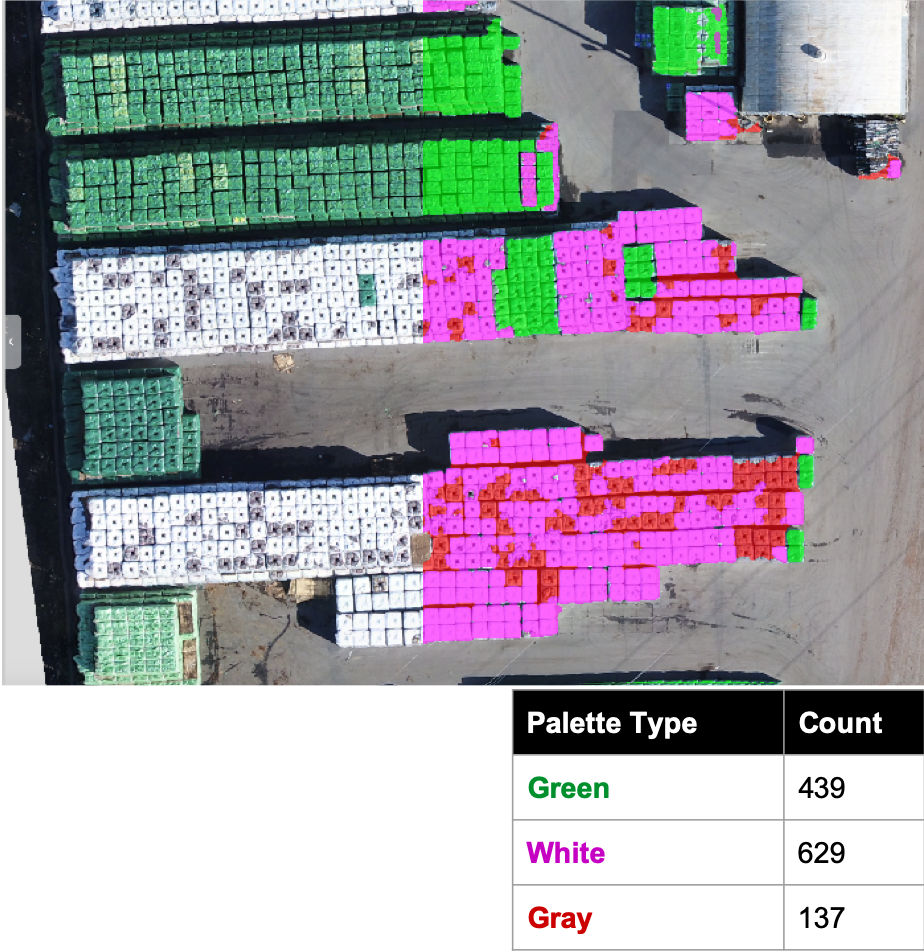
Inventory count of palette types in storage field
Palettes detected and classified into their different types. Enabled drones to be used for automated inventory management of vast storage fields.
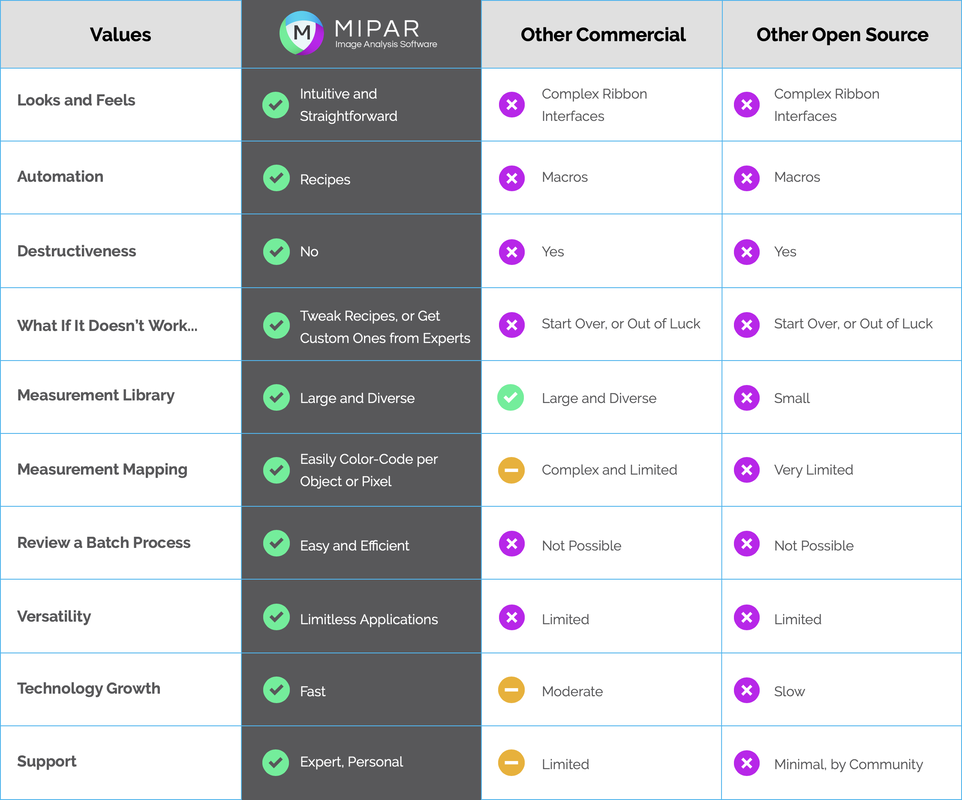
How Does MIPAR Compare?
/
- 1
- 2
- 3
- 4
- 5
I’m so pleased with my MIPAR experience, what a great program! I’m using it to treat data which I’m totally new at, so it’s great with a user friendly program. I really like your tutorials too.

Kirsten / Chemistry
- 1
- 2
- 3
- 4
- 5
/
- 1
- 2
- 3
- 4
- 5
The software is AMAZING!!! I've done a lot of analysis with it. You did a really great job.

Marcela / Chemistry
- 1
- 2
- 3
- 4
- 5
/
- 1
- 2
- 3
- 4
- 5
I have been through different applications and I find this software very user friendly. Thank you for this creation!

Cecilia / Porosity
- 1
- 2
- 3
- 4
- 5
/
- 1
- 2
- 3
- 4
- 5
These recipes work perfectly for my images...MIPAR has definitely made my life easier!!

Abhishek / Materials Science
- 1
- 2
- 3
- 4
- 5
/
- 1
- 2
- 3
- 4
- 5
I'm fascinated how intuitive and straight forward your program is.

Robert / Cardiology
- 1
- 2
- 3
- 4
- 5
/
- 1
- 2
- 3
- 4
- 5
MIPAR is a great program. The idea of 'Recipes' is especially useful. I can recommend it for all researchers who need segmentation for their work.

Lazar / Nanoparticles
- 1
- 2
- 3
- 4
- 5
/
- 1
- 2
- 3
- 4
- 5
MIPAR's flexible recipe functions were able to overcome the limitations I experienced in other image processing applications.

Chris / Plant Science
- 1
- 2
- 3
- 4
- 5
/
- 1
- 2
- 3
- 4
- 5
I have used them all: ImageJ, commercial ones...there's just nothing like MIPAR. It's amazing.

Adam /
Metallurgy
Metallurgy
- 1
- 2
- 3
- 4
- 5
/
- 1
- 2
- 3
- 4
- 5
I have to say it is more intuitive than other programs I have used, so that’s a big advantage!

Kim / Geology
- 1
- 2
- 3
- 4
- 5
/
- 1
- 2
- 3
- 4
- 5
It's so cool...a big kudos to you guys.
Raphael / Physics
- 1
- 2
- 3
- 4
- 5
- 0
- 1
- 2
- 3
- 4
- 5
- 6
- 7
- 8
- 9
❶ FasterOther software simply cannot offer the same ease-of-use and flexibility as MIPAR's Recipe technology.
Build, download, or request a Recipe to solve your problem in a fraction of the time needed with other software. Once you've got a Recipe, you've always got it. Load it up next time you need it and easily share with others. |
❷ More PowerfulThe combination of Recipes and MIPAR's image processing toolbox is quite an unparalleled force.
MIPAR's Recipes let you string together tools to solve problems in ways you never imagined. Bring in state-of-the-art technology like Deep Learning, and you'll be developing automated solutions to problems you haven't been able to solve before. |
❸ Premium SupportWe take this seriously. You are always just a call, email, or live chat away from any help you ever need.
The ability to load custom Recipes built by our experts, offers value to users that no other image analysis software can match. Our experience becomes your experience — and MIPAR is then even better. |
Trusted by the Best
|
Vertical Divider
Industry ApprovedSolutions meet or exceed ASTM standards. Case studies in:
Additive Manufacturing Aerospace Biotechnology Life Science Agriculture. |
Vertical Divider
Used Around the Globe
|


|


|


|